Most advertisers drown in data while starving for insights.
When you open the TikTok Ads Manager in 2026, you are greeted with a default dashboard filled with vanity metrics like Impressions, Total Cost, and Clicks.
While these numbers tell you that you spent money, they do not tell you why you made (or lost) money.
In the current era of Smart+ automation and privacy-first tracking, the metrics that actually matter have shifted.
Click-Through Rate (CTR) is no longer the holy grail; Thumbstop Rate and Hold Rate are.
Get Up to $6000 Free TikTok Ad Credit
Return on Ad Spend (ROAS) is useful, but without understanding View-Through Attribution (VTA), you will likely pause your most influential brand-building campaigns.
To win in 2026, you must stop looking at the default view and start building a Profit Dashboard.
You need to measure the quality of attention your creative generates, not just the volume of traffic it buys.
This guide provides the definitive glossary and strategy for TikTok Ad Reporting Metrics 2026.
We will break down the exact benchmarks you need to hit, how to configure your custom columns to see the truth, and how to interpret the data to scale your campaigns with confidence.
Table of Contents
Key Takeaways
- The Creative Health Stack: Before looking at sales, look at retention. If your Hold Rate (6-second view) is low, your storytelling is weak, and no amount of bidding strategy will fix it.
- View-Through Is Valid: In 2026, up to 40% of TikTok conversions happen without a click. Users view the ad, close the app, and search on Google. Ignoring VTA (View-Through Attribution) leads to underestimating your ad performance.
- Custom Columns are Mandatory: The default dashboard hides critical metrics like Cost Per Complete Payment and 3-Second Video Views. You must manually build a custom column preset to see the full picture.
- Frequency Warning: Monitor Frequency closely. On TikTok, ad fatigue sets in when frequency crosses 3.0 in a week. This is much lower than Facebook’s tolerance.
- Engagement lowers CPM: TikTok’s algorithm rewards high engag ement (Shares/Comments) with lower CPMs. Tracking Engagement Rate is a direct way to monitor your traffic costs.
Phase 1: The Creative Health Metrics (Leading Indicators)
These metrics predict success before a single sale happens. They tell you how users are consuming your content.
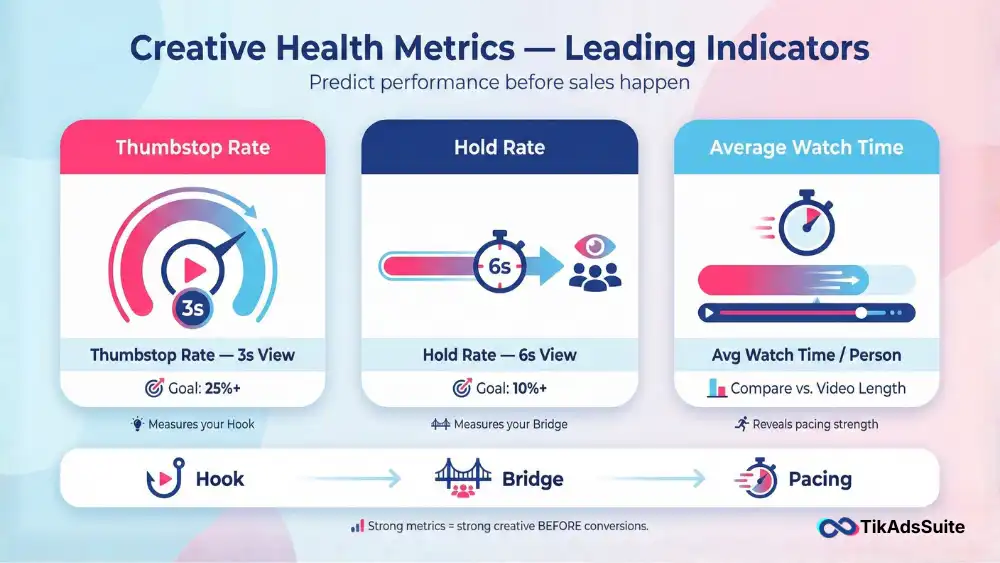
1. Thumbstop Rate (3-Second View Rate)
Definition: The percentage of impressions that watched at least the first 3 seconds of your video.
Formula: (3-Second Video Views / Impressions) * 100
2026 Benchmark: > 25% (Excellent is > 35%).
The Insight: This measures your Hook. If your Thumbstop Rate is 10%, your opening visual is boring. You don’t need a new video; you need to re-edit the first 3 seconds to be more visually arresting or controversial.
2. Hold Rate (6-Second View Rate)
Definition: The percentage of impressions that stayed for at least 6 seconds.
2026 Benchmark: > 10%.
The Insight: This measures your Bridge. If you hooked them (high Thumbstop) but lost them immediately (low Hold Rate), your script failed to connect the hook to the product. You clickbaited them.
3. Average Watch Time per Person
Definition: The average duration a unique user spent watching your ad.
The Insight: Compare this against your total video length. If your video is 30 seconds long and the average watch time is 3 seconds, your pacing is too slow.
Tool Tip: Is your creative holding attention? Use the TikTok Ad Performance Analyzer. Upload your campaign data CSV, and it will visualize your retention curves against industry standards to pinpoint exactly where you are losing the audience.
Phase 2: The Financial Metrics (Lagging Indicators)
These metrics tell you if the attention you bought actually turned into profit.
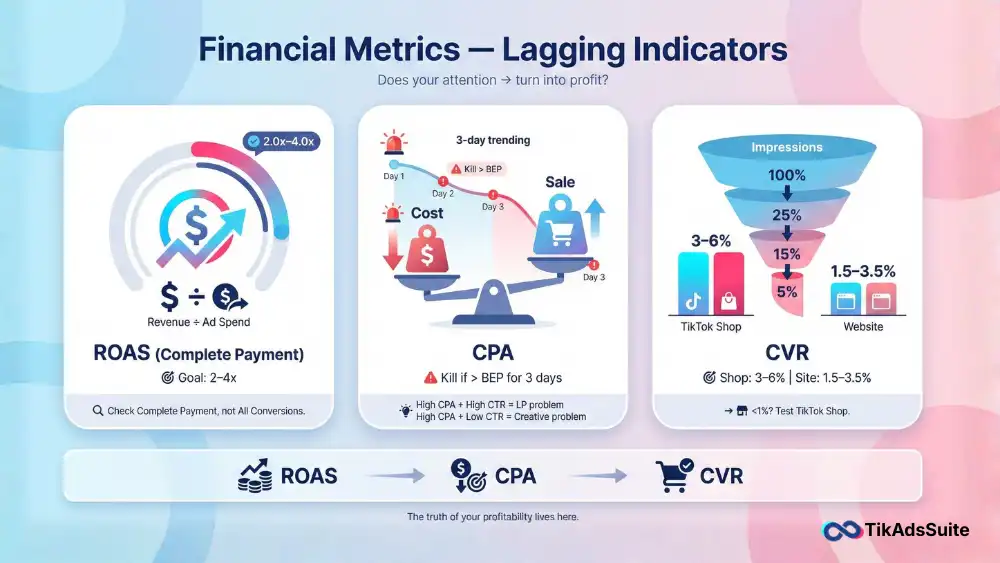
4. Complete Payment ROAS (Return on Ad Spend)
Definition: Total Revenue generated / Total Ad Spend.
2026 Benchmark: 2.0x – 4.0x for eCommerce (varies by margin).
The Nuance: Ensure you are looking at Complete Payment ROAS, not All Conversions. TikTok sometimes bundles Add to Cart values into generic conversion columns if not configured correctly.
5. CPA (Cost Per Acquisition)
Definition: Total Spend / Number of Sales.
The Strategy: This is your primary Kill/Scale metric. If your CPA exceeds your Break-Even Point (BEP) for more than 3 days, kill the ad group.
Optimization: If CPA is high but CTR is high, your landing page or pricing is the issue. If CPA is high and CTR is low, your ad creative is the issue.
6. Conversion Rate (CVR)
Definition: Percentage of clicks that resulted in a sale.
2026 Benchmark: 1.5% – 3.5% (Shopify), 3.0% – 6.0% (TikTok Shop).
The Insight: TikTok Shop CVR is significantly higher because it reduces friction. If you are sending traffic to a website and seeing <1% CVR, consider testing a TikTok Shop integration.
Tool Tip: Unsure if your current metrics are profitable? Use the TikTok Ads ROAS Calculator to input your product costs and ad spend. It will reveal your Real ROAS (Net Profit) rather than just the gross revenue shown in the dashboard.
Phase 3: The Hidden Metrics (Attribution & Frequency)
These numbers are often ignored but are critical for long-term account health.
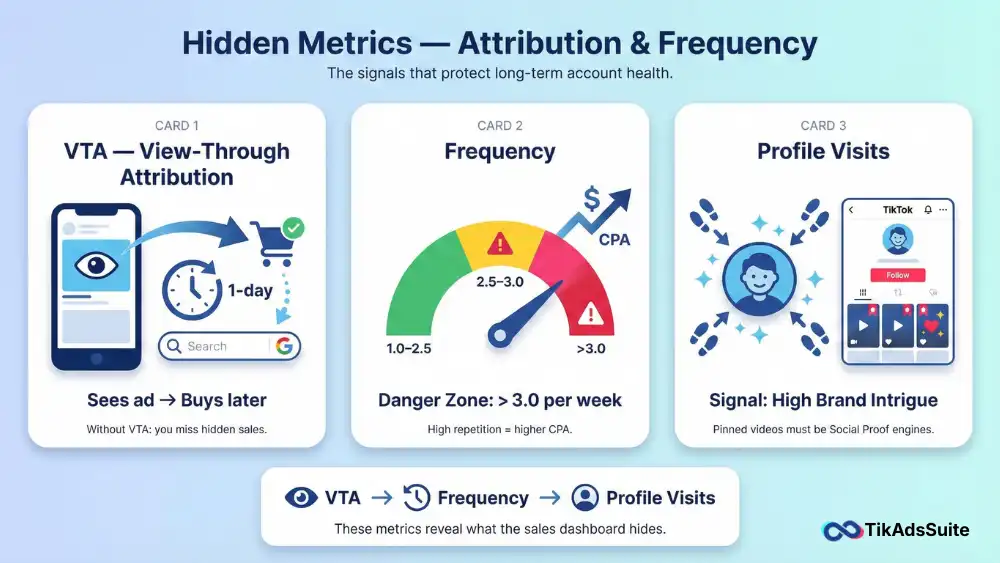
7. View-Through Attribution (VTA)
Definition: Conversions that happened after a user saw your ad, didn’t click, but bought later (within 1 day).
Why it matters: In 2026, privacy-conscious users often avoid clicking ads. They see your product, close TikTok, and search for it on Google. If you disable VTA columns, you might think an ad has 0 sales when it actually drove 5 sales via search.
8. Frequency
Definition: The average number of times a unique user saw your ad.
2026 Danger Zone: > 3.0 (Weekly).
The Insight: Unlike Facebook where high frequency is tolerated, TikTok users hate repetition. As frequency creeps past 3.0, your CPA will almost always rise. Use this metric to know when to swap out creatives.
9. Profile Visits
Definition: The number of users who clicked your avatar to view your profile page.
The Insight: A high number here indicates your ad is building Brand Intrigue. Users are vetting you. Ensure your pinned videos are strong Social Proof assets (testimonials, founder story) to convert this traffic.
How to Set Up Your Custom Columns
Do not use the default view. Log into Ads Manager, click Columns, select Custom Columns, and arrange them in this Funnel Order for maximum clarity:
- Cost (Spend)
- CPM (Cost of Traffic)
- CTR (Click Intent)
- Thumbstop Rate (2-Sec View %) – Must select manually
- Engagement Rate (Virality)
- CPC (Cost per Click)
- Add to Cart (Intent)
- Complete Payment (Sales)
- Cost Per Complete Payment (CPA)
- Complete Payment ROAS (Profit)
Tool Tip: Keeping track of your daily pacing across multiple campaigns can be a nightmare. Use the TikTok Ad Spend Tracker to monitor your daily burn rate and ensure you aren’t overspending on high-CPA days.
More helpful articles you’ll want to explore:
👉 TikTok Ads Credit: Get Free $6000 Cash Back Promo
👉 TikTok Ads for Local Businesses: How Small Businesses Attract Nearby Buyers
👉TikTok Ad Optimization Checklist: Boost ROAS Step by Step
👉 TikTok Ad Placement Options Explained: What Works Best Today
FAQ: TikTok Ad Reporting Metrics
Why is my CPM so high compared to last year?
CPM (Cost Per Mille) rises as competition increases. However, a sudden spike in CPM usually indicates Creative Fatigue (users are hiding your ad) or Low Relevance. If your engagement rate drops, TikTok charges you more for impressions. Refresh your creative to lower CPM.
What is the difference between Total Conversion Value and Real Value?
Total Conversion Value in TikTok is based on the data passed by your Pixel. If your Pixel isn’t passing shipping costs or tax correctly, this number might be inflated. Always cross-reference with your Shopify dashboard using UTMs.
How do I improve my Thumbstop Rate?
If you are below 25%, you need a Pattern Interrupt. Start your video with a question, a visual shock (e.g., dropping something), or a Negative Hook (e.g., Stop doing this). Static openings kill retention.
Should I trust TikTok’s Estimated Results?
No. TikTok’s forecasting tools are optimistic estimates. Always make decisions based on your Actual Realized Data (ROAS and CPA) from the last 3-7 days, not the platform’s predictions.
Conclusion: Data is Your Compass
Navigating TikTok Ad Reporting Metrics in 2026 is about separating the Vanity from the Value.
Impressions stroke your ego; ROAS pays your rent. But to get the ROAS, you must master the Thumbstop Rate.
By setting up your dashboard to follow the user journey, from the first 3 seconds of attention to the final credit card swipe, you can diagnose exactly where your funnel is leaking and fix it with surgical precision.
Your Action Plan:
- Log into Ads Manager and build the Funnel Order custom column preset.
- Audit your active ads: Pause anything with a Thumbstop Rate < 20%.
- Check your Frequency: If any ad is above 3.0, schedule a creative refresh immediately.
Stop staring at the default view. Take control of your data.