You might be losing money, and you don’t even know it. If you don’t understand what TikTok Ads Metrics is, you might be in trouble.
You spend the budget, run the ads, and in the end, you’re staring at a dashboard full of numbers with no idea what they are and what they do.
That is a fatal problem. TikTok Ads Manager gives you dozens of data points. Without knowing which ones matter for what, you make the wrong decision with the wrong idea.
You might pause a campaign that was about to convert. Or you keep running ads that look strong on the surface but drain your budget to zero with no return.
TikTok is one of the most active paid platforms right now. According to Statista, TikTok has approximately 1.59+ billion active users globally. (1) The platform is growing, the Ad spend is growing, and the competition for attention is also growing.
This guide covers every key TikTok ads metric, from the basics to the advanced layers. You will walk away knowing exactly what to measure, how to read it, and how to use that data to make smarter decisions.
Get Up to $6000 Free TikTok Ad Credit
Table of Contents
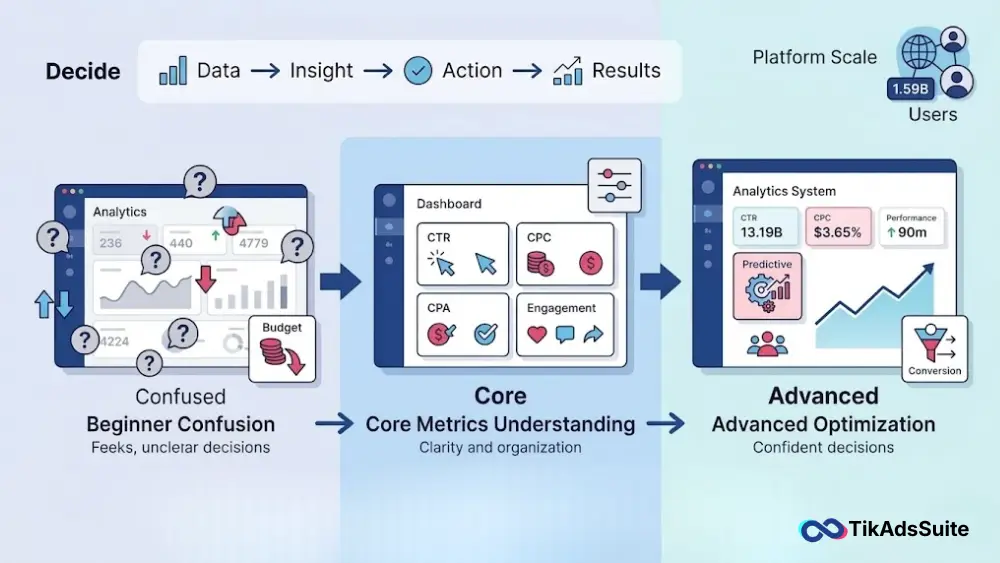
What Are TikTok Ads Metrics?
TikTok Ads metrics are the measurable data points inside TikTok Ads Manager that tell you how your ads are performing. Each metric captures one specific aspect of your campaign, whether that is how many people saw your ad, how many clicked, or how much you paid per result.
Think of metrics as your feedback system. Without them, you are running blind. And, with them, you can see exactly where your campaign is working and where it is losing money.
What Are the Most Important TikTok Ads Metrics?
The most important TikTok Ads metrics are ROAS, CPA, CTR, and Engagement Rate, because they directly connect your spend to your results. You track impressions and reach to understand distribution, CTR to evaluate creative quality, and CPA or ROAS to judge financial performance. Your results may vary based on your campaign objective, industry, and attribution window settings.
Metrics vs KPIs in TikTok Ads
These two terms get used interchangeably, but they are not the same thing.
A metric is a raw measurement. Impressions, clicks, and video views are all metrics. They just count what happened.
A KPI (Key Performance Indicator) is the specific metric you choose to judge success against your campaign goal. If your goal is sales, your KPI might be ROAS or CPA. If your goal is brand awareness, your KPI might be impressions or reach.
Every KPI is a metric. But not every metric is a KPI. Your job is to identify which metrics align with your campaign objective and treat those as your KPIs. The rest are supporting data.
Core TikTok Ads Metrics Explained
These are the metrics you will see most often inside TikTok Ads Manager. Understanding each metric individually will give you the foundation to read any ad campaign clearly.
At-a-glance overview of TikTok ad metrics
| Metric | Formula | What It Measures | Primary Use |
| Impressions | N/A | Total ad displays | Distribution volume |
| Reach | N/A | Unique users who saw the ad | Audience size |
| CTR | (Clicks / Impressions) x 100 | Ad relevance and creative pull | Creative performance |
| Conversion Rate | (Conversions / Clicks) x 100 | Post-click effectiveness | Funnel efficiency |
| CPC | Spend / Clicks | Cost per click | Click cost efficiency |
| CPM | (Spend / Impressions) x 1,000 | Cost per 1,000 impressions | Reach cost efficiency |
| CPA | Spend / Conversions | Cost per result | Budget-to-outcome ratio |
| Engagement Rate | (Engagements / Impressions) x 100 | Audience interaction quality | Content resonance |
| Video Completion Rate | (Full Views / Impressions) x 100 | Watch-through quality | Creative retention |
Impressions and Reach
Definition: Impressions count the total number of times your ad was displayed on screen. Reach counts the number of unique users who saw it at least once.
Formula: Reach = number of unique accounts that saw the ad at least once. Impressions have no formula. They accumulate with every display.
What it measures: How widely your ad is being distributed across the platform.
Why it matters: High impressions with low reach mean the same people are seeing your ad repeatedly. That signals ad fatigue. If your frequency is climbing while conversions are dropping, your audience has likely seen your creative too many times.
Example: Your campaign shows 500,000 impressions but only 100,000 reach. Your average frequency is 5. Each person saw your ad five times. For most campaigns, that is too high, and it is time to refresh your creative.
This case study about Camp Bow Wow shows a success story regarding reach and Impressions. According to TikTok, they have gotten 6 M+ impressions, 23 K landing page views, and 1.9 M+unique users reached. Giving a perfect example of what a good reaching ad can be.
- 7.6M+ Impressions at $6.02 CPM: Scaled awareness nationwide while keeping costs low.
- 23K Landing Page Views at $2.01 CPLPV: Successfully drove cost-efficient traffic to the brand’s site.
- 1.9M+ Unique Users Reached: Achieved significant national reach with an average frequency of 3.91.
Clicks and Click-Through Rate (CTR)
Definition: Clicks measure how many times someone tapped your ad. CTR is the percentage of people who saw your ad and then clicked it.
Formula: CTR = (Clicks / Impressions) x 100
What it measures: How relevant and compelling your ad is to the audience seeing it.
Why it matters: CTR is one of the fastest signals you have on creative performance. A low CTR on a broad audience usually means the ad is not resonating. A high CTR means the content is connecting.
Example: Your ad generates 2% CTR on 1 million impressions. That produces 20,000 clicks. The same creative at 0.5% CTR gives you only 5,000 clicks from identical spend. Creative quality directly multiplies or shrinks your output without changing your budget.
Conversions and Conversion Rate
Definition: A conversion is a specific action a user takes after seeing your ad, such as a purchase, form fill, or app install. Conversion rate is the percentage of clicks that resulted in a conversion.
Formula: Conversion Rate = (Conversions / Clicks) x 100
What it measures: How effectively your ad and landing page work together to produce results.
Why it matters: You can have excellent CTR and still have a failing campaign if your conversion rate is low. This metric tells you whether the traffic you are paying for is actually doing something valuable.
Example: Your lead generation campaign gets 10,000 clicks. If 300 of those clicks become form submissions, your conversion rate is 3%. If your target CPA is $15 and you spent $4,500, that puts you exactly on target.
Cost Metrics (CPC, CPM, CPA)
Definition:
- CPC (Cost Per Click): What you pay every time someone clicks your ad
- CPM (Cost Per Mille): What you pay per 1,000 impressions
- CPA (Cost Per Action): What you pay for each completed conversion
Formulas:
- CPC = Total Spend / Total Clicks
- CPM = (Total Spend / Impressions) x 1,000
- CPA = Total Spend / Total Conversions
What it measures: The ad cost efficiency of your campaign at different stages of the funnel.
Why it matters: These three metrics tell you where your money is going. CPM tells you the cost to reach people. CPC tells you the cost to get interest. CPA tells you the cost to get results. According to Lebesgue, TikTok’s average CPM is $4.8, though this varies significantly by industry, audience size, ad format, and campaign objective.
Example: If you pay $10 CPM and your CTR is 1%, your effective CPC is $1. If 5% of those clicks convert, your CPA is $20. Understanding this chain helps you find exactly where costs are leaking.
This case study for Telekom Serbia tells you a better story of CPM, CPC, & CPA. This study showcases their -19.4 % CPC, -27 % CPM, and -9.46 % CPA. This is what a good Cost Metrics can look like.
- Maximum delivery bid strategy to scale reach
- Frequency capping to avoid ad fatigue
- Native, engaging creatives designed to feel authentic in the TikTok feed
Engagement Metrics (Likes, Comments, Shares)
Definition: These metrics count how users interact with your ad content beyond just watching or clicking.
What it measures: The emotional and social response your ad generates.
Why it matters: Shares are the most powerful of the three because they extend your reach organically beyond your paid audience. Comments often reveal how your message actually lands. High engagement relative to impressions signals that your creative resonates with the people seeing it.
Example: Say you run a product demonstration ad for your eCommerce store. Your ad gets 500,000 impressions, 4,200 shares, and 900 comments. Most comments show users tagging friends. That organic behavior amplifies your campaign without additional cost.
Video View Metrics
Definition: TikTok tracks video views at multiple watch thresholds: 2-second views, 6-second views, and 100% completion rates.
What it measures: How long your audience is willing to watch your ad before scrolling past.
Why it matters: Watch time directly signals content quality to TikTok’s algorithm. The first 3 seconds of a TikTok ad are critical. Ads that hold attention past 3 seconds consistently see better delivery and lower CPMs over time.
Example: Your ad has 100,000 impressions. If 80,000 users watch for 2 seconds but only 12,000 reach the 6-second mark, you have a drop-off problem between seconds 2 and 6. Your hook is working; your middle section is losing people. That is a precise, creative diagnosis.
Optimize your TikTok ad with our free TikTok marketing tools to calculate your ROAS, Engagement, CPM, CPC, Conversion Rate, and CTR rates.
Advanced TikTok Ads Metrics Categories
Once you have a handle on core metrics, TikTok Ads Manager opens up deeper reporting layers. (2) These are where serious campaign optimization happens.
At-a-glance overview of advanced TikTok ad metrics
| Category | Key Metrics | Tracking Method | Best Used For |
| Attribution | Click-through conversions, View-through conversions | Ads Manager attribution settings | Understanding full conversion credit |
| In-App Events | Installs, purchases, tutorial completion, subscriptions | TikTok SDK or MMP (Adjust, AppsFlyer) | Mobile app campaign quality |
| Onsite Events | ViewContent, AddToCart, InitiateCheckout, CompletePayment | TikTok Pixel | Website funnel drop-off analysis |
Attribution Metrics
Attribution metrics show which touchpoints in a user’s journey led to a conversion. TikTok supports both click-through attribution and view-through attribution. (3)
Click-through attribution credits the ad when a user clicks and then converts within a set window, typically 7 days. View-through attribution credits the ad when a user saw it without clicking, but later converted, usually within 1 day.
Why this matters: if you only track click attribution, you undercount the true impact of your campaigns. Many TikTok users discover a brand through an ad, do not click immediately, and convert later through a direct visit or organic search. View-through attribution captures that path.
Set your attribution window before your campaign launches. Changing it mid-campaign alters your reported results and makes performance comparisons unreliable.
In-App Event Metrics
These metrics apply when you run campaigns with a mobile app objective. They track specific user behaviors inside your app after a user installs or reengages.
Common in-app events include: tutorial completion, level reached, in-app purchase, subscription start, and adding payment info.
You track these by integrating TikTok’s SDK into your app or passing events through a Mobile Measurement Partner (MMP) such as Adjust or AppsFlyer.
Why this matters: install volume tells you one thing, but post-install quality tells you everything. An ad set generating 1,000 installs where 40% complete a purchase is worth far more than one generating 2,000 installs where only 5% take any meaningful action.
Onsite and Conversion Event Metrics
These apply to website campaigns using TikTok Pixel. The Pixel tracks user actions on your website and reports them back to Ads Manager.
Standard events include: View Content, Add To Cart, Initiate Checkout, Complete Payment, and Submit Form.
Each of these becomes a measurable metric inside your campaign. You can optimize your bid directly toward any of these events. If you optimize for “Add To Cart” events, TikTok’s algorithm will find users most likely to add a product to their cart.
According to TikTok for Business, 1 in 3 TikTok users purchased a product they first saw on the platform. That purchase path starts with a ViewContent event and ends with CompletePayment. Tracking each step shows you exactly where users drop off in your funnel.
Most Important TikTok Ads Metrics to Focus On
Not all metrics deserve equal attention. These four are the ones you should prioritize when optimizing for real results.
At-a-Glance Overview of the most important TikTok Ad Metrics
| Metric | Formula | Why It Matters | Campaign Type |
| ROAS | Revenue / Ad Spend | Measures direct profitability | eCommerce, DTC |
| CPA | Spend / Conversions | Measures budget efficiency per result | Lead gen, app installs, sales |
| CTR | (Clicks / Impressions) x 100 | Diagnoses creative performance | All campaign types |
| Engagement Rate | (Engagements / Impressions) x 100 | Measures content resonance and organic lift | Brand awareness, content campaigns |
ROAS (Return on Ad Spend)
ROAS gives you a real number to optimize around instead of surface-level vanity metrics.
Definition: ROAS measures how much revenue you generate for every dollar you spend on ads.
Formula: ROAS = Revenue from Ads / Ad Spend
Why it matters: ROAS is the clearest indicator of whether your ad spend is profitable. A ROAS of 3 means you earned $3 for every $1 spent. Whether that is good depends entirely on your profit margins. A product with 80% margin can be profitable at ROAS 2. A product with 20% margin might need ROAS 5 just to break even.
CPA (Cost Per Action)
CPA is the metric that most directly connects your media spend to your business outcome.
Definition: CPA tells you the exact cost to produce one conversion, whether that is a purchase, lead, or app install.
Why it matters: CPA is your budget efficiency score. If your target CPA is $25 and your actual CPA is $60, the campaign is not viable without changes. You can improve CPA by refining audience targeting, improving ad creative, or strengthening your post-click experience.
CTR (Click-Through Rate)
CTR benchmarks vary by industry and ad format. Always compare your CTR against your own historical baseline before comparing it to industry averages.
Definition: The percentage of ad viewers who clicked through to your destination.
Why it matters: CTR is your creative quality signal. We use CTR as the first filter when diagnosing a campaign. If CTR is low, the problem is usually the ad itself, not the audience or the offer. If CTR is strong but CPA is high, the problem moves downstream to the landing page or funnel.
Engagement Rate
Definition: Engagement rate measures the percentage of viewers who interacted with your ad through likes, comments, shares, or saves relative to total impressions.
Formula: Engagement Rate = (Total Engagements / Impressions) x 100
Why it matters: High engagement on a paid ad signals that the content feels native to TikTok. This matters because TikTok’s algorithm rewards content that people genuinely interact with. Strong engagement can lower your delivery costs over time and extend your ad’s organic reach beyond the paid audience.
How TikTok Ads Metrics Work Together
A single metric never tells the full story on its own. Reading them in combination is the correct way to get to your real insights.
Start with impressions and reach out to understand the distribution. Move to CTR to evaluate creative performance. Then look at the conversion rate to assess the landing page’s effectiveness. Finally, check CPA and ROAS to determine whether the campaign is financially viable.
When you see a problem at one level, it isolates where to fix it. Low CTR points to a creative issue. High CTR with low conversion rate points to a post-click issue. A healthy conversion rate with poor ROAS points to a pricing or margin issue.
The chain looks like this: reach builds awareness, CTR filters for intent, conversion rate captures results, and CPA and ROAS judge overall value.
You also need to watch frequency alongside engagement. As frequency climbs past 4 to 5 views per user, engagement typically drops, and CPC tends to rise. That is a signal to rotate your creative.
Instead of guessing, understanding these relationships lets you pinpoint the exact stage where your funnel is leaking.
Common Mistakes When Reading TikTok Ads Metrics
Sometimes, even experienced advertisers misread campaign data. Here is a list of the most consistent mistakes advertisers make while reading TikTok ad metrics.
Optimizing for CTR alone. A high CTR with zero conversions means nothing. CTR measures interest, not intent. Always trace the full funnel before calling an ad successful.
Ignoring attribution windows. If you set a 7-day click attribution window and compare it to a 1-day window, your numbers will look completely different. Make sure your attribution settings are consistent when comparing campaigns.
Comparing CPMs without context. A $5 CPM in a cold audience campaign and a $15 CPM in a retargeting campaign can both be completely appropriate. Higher CPM does not always mean worse performance. Retargeting audiences are smaller and more qualified, so higher CPMs are expected.
Judging campaigns too early. TikTok’s algorithm needs time to exit the learning phase. According to TikTok’s advertiser documentation, this typically requires at least 25 campaign results per ad set within a 7-day period. Pausing campaigns before that threshold resets the learning process and wastes the spend you already put in.
Treating video views as conversions. A 100% video completion rate is encouraging, but it does not mean the viewer took action. Video metrics and conversion metrics are different layers. Do not conflate them.
Ignoring creative fatigue signals. If your CTR and ROAS were strong in week one and have dropped in week three without any targeting changes, your creative is likely fatigued. Frequency data will usually confirm this before your costs visibly spike.
FAQs
What is a good CTR for TikTok ads?
CTR benchmarks vary by industry, ad format, and audience type, so there is no universal good number. In general, a CTR above 1% is considered a starting benchmark for In-Feed Ads, though well-optimized campaigns with strong native creative regularly achieve 2% to 3%. Your best benchmark is your own historical average. If your new ad consistently outperforms your previous campaigns, that is the signal that matters most.
What does CPM mean in TikTok ads?
CPM stands for Cost Per Mille, which means the cost you pay for every 1,000 times your ad is shown to users. It is a reach-based metric used primarily in awareness campaigns. You calculate it by dividing your total spend by your total impressions, then multiplying by 1,000. A lower CPM means you are reaching more people for less money, though audience quality also affects whether those impressions produce results.
How is ROAS calculated in TikTok ads?
ROAS is calculated by dividing the total revenue attributed to your ads by the total amount you spent. For example, if you spent $1,000 and generated $4,000 in tracked revenue, your ROAS is 4. TikTok calculates this automatically inside Ads Manager when you have conversion tracking set up through the TikTok Pixel or SDK. The figure you see will depend on your attribution window settings.
Which TikTok ads metric should I focus on for a new campaign?
For a new campaign, start with CTR to evaluate whether your creative is connecting with your audience, then track CPA to understand your conversion cost. If you are running a direct-response campaign with a purchase goal, ROAS should become your primary KPI once you have enough conversion data, typically after 50 or more conversion events. In the early stages, prioritize learning over optimization and avoid making major changes before the algorithm exits its learning phase.
What is the difference between reach and impressions on TikTok ads?
Reach counts the number of unique users who saw your ad at least once. Impressions count the total number of times your ad was displayed, including multiple views by the same user. If your impressions are much deeper than your reach, your frequency is high, meaning the same users are seeing your ad repeatedly. This gap helps you diagnose ad fatigue before your performance metrics start to visibly decline.
How do I know if my TikTok ad campaign is performing well?
A campaign is performing well when your CPA is at or below your target, your ROAS is above your break-even threshold, and your CTR is stable or improving over time. You should also check that your frequency is not climbing past 4 to 5 without a corresponding creative refresh. If your video completion rate is above 25% and your conversion rate is above your site’s baseline average, those are positive signals. Consistent improvement across these metrics over a 7 to 14-day period is a stronger indicator than any single day of data.
Final Summary: Understanding TikTok Ads Metrics in 2026
TikTok Ads metrics are not just numbers on a dashboard. They are a structured feedback system that tells you what is working, what is failing, and where to put your attention next.
You now have a clear picture of every core metric: what impressions and reach tell you about distribution, what CTR reveals about your creative, how conversion rate and CPA connect your spend to real outcomes, and how ROAS gives you a direct profitability signal.
We also covered the advanced layers, including attribution windows, in-app events, and onsite conversion tracking, which most people skip, but that make a significant difference in how accurately you read performance.
The key principle is this: read metrics in sequence. Start broad with reach and impressions, then move inward toward CPA and ROAS. Use engagement and video view data to guide creative decisions. Use cost metrics to manage budget efficiency. Never judge a campaign on one metric in isolation.
You do not need the biggest budget to build profitable TikTok campaigns. You need to understand what the data is telling you and act on it with precision. That is exactly what this guide is built to help you do.
Resources used for this article: