
If your TikTok ads feel like they’re underperforming, the real question isn’t whether your numbers are bad. It’s what they are bad compared to. TikTok ads benchmarks by industry give you that reference point.
A CTR that looks weak for an apparel brand can be normal for a pet brand. Without a category baseline, it is easy to fix the wrong thing.
This page lays out current CPM, CTR, CPA, conversion rate and ROAS medians for ten ecommerce industries, with the period and source for each number, so you can see where your campaigns stand and what to work on next.
Here’s what you’ll find below:
- Overall TikTok ad benchmarks and how they moved year over year
- CPM, CPA, order value, ROAS, conversion rate and CTR by industry
- A closer look at Beauty and skincare numbers
- What TikTok itself reports about Spark Ads
- What to fix first when you are below benchmark
Get Up to $6000 Free TikTok Ad Credit
Table of Contents
Quick Answer
TikTok ad benchmarks for August 2025 to July 2026 put overall CPM at $4.08, CTR at 0.61%, conversion rate at 1.56%, CPA at $17.07 and ROAS at 1.51, based on Triple Whale’s TikTok benchmarks across more than 5,900 brands. Costs fell from the year before, but so did click and conversion rates.
Your own target depends on your category. The tables below show the medians for ten ecommerce industries, so compare against your row, not the overall number.
Key Takeaways
- In Triple Whale’s latest year of data, TikTok CPM and CPA both dropped, while CTR and conversion rate also slipped.
- CPM sits in a narrow band across industries, so most of the difference in cost per sale comes from conversion rate and order value.
- Apparel & Accessories led on ROAS, while Beauty, Health & Wellness and Food & Beverage sat near the bottom despite low CPA.
- TikTok’s own Spark Ads in Video Shopping Ads page reports a higher conversion rate for Spark Ads than for standard ads.
- Ads Manager can rank your videos against others in your industry, which is the closest benchmark to your own account.
What Are TikTok Ads Benchmarks?
TikTok ads benchmarks are average performance metrics, CPM, CTR, CPC, CPA, CVR, and ROAS, measured across a large sample of campaigns within a specific industry or across all verticals. They give advertisers a realistic reference point for evaluating campaign health. Because TikTok’s ad auction, audience behavior, and creative format differ significantly from other platforms, benchmarks from Meta or Google don’t apply here.
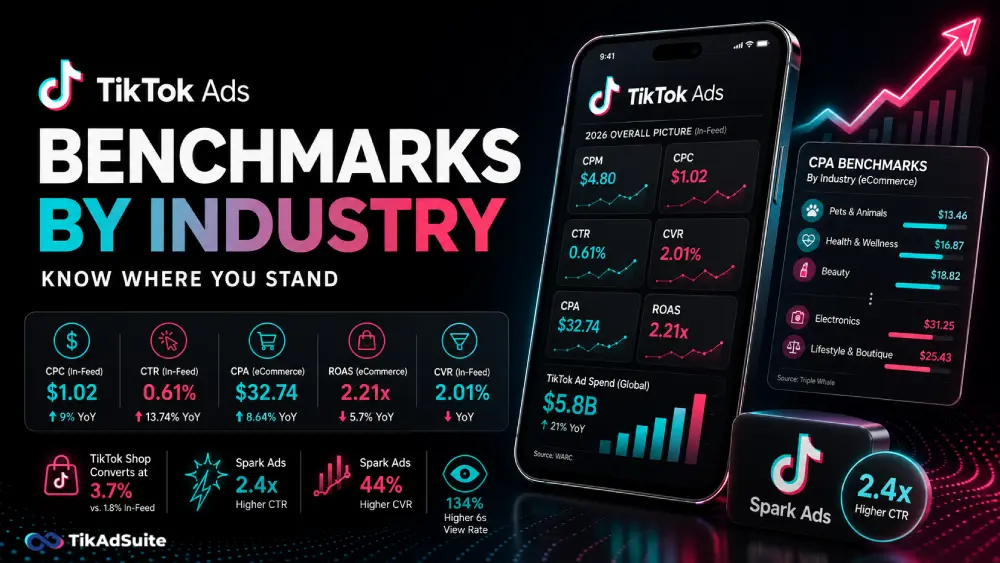
2026 TikTok Ads: The Overall Picture
The overall picture for TikTok ads is cheaper reach with weaker response. The table compares Triple Whale’s overall figures for the latest year with the year before.
| Metric | Aug 2024 to Jul 2025 | Aug 2025 to Jul 2026 |
|---|---|---|
| CPM | $5.71 | $4.08 |
| CTR | 0.70% | 0.61% |
| Conversion rate | 2.46% | 1.56% |
| CPA | $24.86 | $17.07 |
| ROAS | 1.43 | 1.51 |
| Average order value | $46.90 | $50.32 |
Read the rows together. Impressions and sales got cheaper, but fewer people clicked and fewer clicks turned into orders. Slightly higher order values helped ROAS hold up.
These figures come from brands that use Triple Whale, mostly ecommerce stores. They are a useful reference, but they are not TikTok’s own numbers, and lead generation or app campaigns can look very different. For a deeper look at how TikTok ad costs break down, separate brand awareness spend from direct-response campaigns, since they run in different cost tiers.
Get Your Own Industry Benchmark in Ads Manager
TikTok also gives you a benchmark built for your account. According to TikTok’s Video Insights help page, you can open Analytics in Ads Manager, pick Video Insights, and see Industry Benchmark rankings that show how your videos perform against others in the same industry.
Use it next to the tables on this page. A third-party median tells you where the market sits, while the in-app ranking tells you how your creative compares with advertisers like you.
TikTok Ads CPM Benchmarks by Industry
TikTok CPM, what you pay per thousand impressions, stays in a fairly tight range across ecommerce industries. The table shows Triple Whale’s median CPM by category for August 2025 to July 2026.
| Industry | Median CPM |
|---|---|
| Home & Garden | $4.61 |
| Pets & Animals | $4.59 |
| Food & Beverage | $4.54 |
| Toys, Art, & Collectibles | $4.40 |
| Electronics | $4.40 |
| Apparel & Accessories | $4.16 |
| Lifestyle & Boutique | $4.01 |
| Beauty | $3.92 |
| Health & Wellness | $3.67 |
| Sports & Outdoors | $3.46 |
The gap between the cheapest and the priciest category is only about a dollar. Every category paid less than the year before, with Health & Wellness and Beauty seeing the biggest drops.
For a closer look at what moves these costs and how to bring them down, see the TikTok CPM rates breakdown.
With CPMs this close, cheap reach rarely decides who wins. Two brands can pay almost the same for impressions and still end up with very different costs per sale.
TikTok Ads CPA, CPM, and AOV Benchmarks by Industry
TikTok ad costs per sale vary far more by industry than CPM does, which is why it matters how these benchmarks compare across industries when you set expectations. The table pairs Triple Whale’s median CPA and CPM with average order value for each category.
| Industry | TikTok CPA | TikTok CPM | Average Order Value |
|---|---|---|---|
| Apparel & Accessories | $20.64 | $4.16 | $73.79 |
| Beauty | $10.32 | $3.92 | $29.35 |
| Home & Garden | $19.33 | $4.61 | $61.28 |
| Food & Beverage | $12.44 | $4.54 | $30.19 |
| Toys, Art, & Collectibles | $18.37 | $4.40 | $47.43 |
| Sports & Outdoors | $14.67 | $3.46 | $51.96 |
| Electronics | $28.90 | $4.40 | $70.72 |
| Health & Wellness | $11.17 | $3.67 | $18.56 |
| Pets & Animals | $5.46 | $4.59 | $0.38 |
| Lifestyle & Boutique | $19.59 | $4.01 | $53.77 |
Source: Triple Whale TikTok benchmarks, medians for August 2025 to July 2026.
Pets & Animals, Beauty and Health & Wellness had the lowest median CPA. Electronics had the highest, which fits a product people tend to research before they buy.
Low CPA can hide a problem. Beauty and Health & Wellness also had some of the lowest order values, so each sale brings in less. Electronics costs more per sale but also brings one of the highest order values.
The Pets & Animals order value in the source looks unusually low and dropped sharply from the year before, so treat that row with care.
CPA and ROAS Benchmarks: The Conversion Picture
ROAS is where category differences show most clearly on TikTok. The table lists Triple Whale’s median ROAS, conversion rate and CTR by industry for August 2025 to July 2026.
| Industry | Median ROAS | Conversion Rate | CTR |
|---|---|---|---|
| Apparel & Accessories | 2.70 | 2.08% | 0.74% |
| Home & Garden | 2.02 | 1.61% | 0.59% |
| Lifestyle & Boutique | 2.00 | 2.06% | 0.61% |
| Electronics | 1.98 | 1.46% | 0.64% |
| Toys, Art, & Collectibles | 1.57 | 1.71% | 0.55% |
| Sports & Outdoors | 1.44 | 0.99% | 0.54% |
| Beauty | 0.46 | 1.12% | 0.51% |
| Health & Wellness | 0.42 | 0.80% | 0.51% |
| Food & Beverage | 0.33 | 0.99% | 0.45% |
| Pets & Animals | 0.02 | 0.38% | 0.41% |
Source: the same Triple Whale report, August 2025 to July 2026.
Categories with higher order values, such as Apparel, Home & Garden and Electronics, sat at the top. Beauty, Health & Wellness and Food & Beverage had low CPA but low ROAS too, because their orders are smaller.
For those lower-ticket categories, first-order ROAS can understate what a customer is worth. Repeat purchases decide whether the campaign pays, so track customer value over time, not only the first sale.
Conversion rate has its own page. The TikTok conversion rate benchmarks explain how to read that number and which Ads Manager column to compare. For campaign structure around these numbers, the TikTok ads for eCommerce guide is a useful companion.
Industry Spotlight: How Your Vertical Stacks Up
Each vertical gets to its results by a different route. The ecommerce categories below use Triple Whale’s medians, while the service categories have no comparable public dataset, so they get practical guidance instead of numbers.
Beauty and Fashion
Beauty and skincare brands get some of the cheapest results on TikTok but also some of the weakest first-order returns. The table shows the Beauty medians next to Apparel & Accessories and the overall figures.
| Metric | Beauty | Apparel & Accessories | All categories |
|---|---|---|---|
| CTR | 0.51% | 0.74% | 0.61% |
| Conversion rate | 1.12% | 2.08% | 1.56% |
| CPM | $3.92 | $4.16 | $4.08 |
| CPA | $10.32 | $20.64 | $17.07 |
| ROAS | 0.46 | 2.70 | 1.51 |
| AOV | $29.35 | $73.79 | $50.32 |
For Beauty, the year-over-year swing was large. CPA and CPM fell sharply, while conversion rate dropped by more than half and ROAS fell too. If your skincare ads show a low CPA but weak ROAS, that matches the category, and the fix is usually bundles, subscriptions or repeat purchase offers rather than more traffic.
Fashion sits at the other end: higher order values and the best ROAS in the dataset. Demo and try-on style videos suit both categories. If you’re in this space, check the TikTok ads for fashion brands breakdown for creative direction.
Fitness and Wellness
Health & Wellness brands in the dataset paid little per sale but earned low ROAS, again because of small order values. The challenge here is standing out, since fitness content on TikTok is crowded. Specific, real stories tend to hold attention better than generic workout clips. The TikTok ads for fitness and gym businesses guide covers what to test in this vertical.
Restaurants and Food & Beverage
Food & Beverage brands selling online had one of the lowest ROAS figures in the dataset. Restaurants and cafes are a different case: they sell locally, so local targeting and a clear call to action matter more than any national median. See the TikTok ads for restaurants and cafes playbook for format ideas.
Travel and Hospitality
Travel has longer decision cycles, so TikTok usually works as an inspiration channel for these brands. You will need retargeting to bring viewers back when they are ready to book. The TikTok ads for travel companies guide walks through how to structure that funnel.
B2B and SaaS
B2B decisions are rarely made on impulse, so ecommerce medians do not apply here. Judge B2B campaigns on cost per qualified lead and pipeline, not on purchase conversion rate. The TikTok ads for B2B companies guide is the right starting point.
Spark Ads vs. In-Feed: What TikTok Reports
Spark Ads, which run ads through real organic posts, show stronger engagement and conversion figures than standard ads in TikTok’s own reporting. TikTok’s Spark Ads in Video Shopping Ads help page lists these results for Spark Ads compared with Non-Spark Ads:
- Engagement rate: 142% higher
- Completion rate: 30% higher
- Conversion rate: 43% higher
- CPM: 4% lower
The page does not give a sample size or time period, and it covers Video Shopping Ads, so treat these as a direction rather than a promise for every account. The safest way to apply it is a split test of Spark and standard versions of the same video.
The Spark Ads vs. non-Spark Ads breakdown covers when to lean into each format.
What to Do When You’re Below Benchmark
If your numbers are trailing your vertical’s benchmarks, here’s how to diagnose the problem:
- Low CTR: Your hook (the first one or two seconds) isn’t stopping the scroll. Test new opening frames, questions, or pattern interrupts before changing targeting.
- High CPC: Broaden your audience or refresh creative. A tired creative gets less engagement, which usually pushes your cost per click up. Reviewing your TikTok ad bidding strategies can help you recalibrate.
- Low CVR: The issue is post-click, not the ad. Check landing page load speed, offer clarity, and checkout friction.
- High CPA: Audit the full funnel. A TikTok ads budget optimization review often reveals that the budget is concentrated in low-CVR placements.
Comparing your TikTok ads metrics against vertical benchmarks regularly, not just quarterly, keeps you ahead of performance drift before it becomes a serious spend problem.
Frequently Asked Questions
What is a good CTR for TikTok ads in 2026?
A good TikTok CTR is one at or above the median for your category in the ROAS table above. Across all categories in Triple Whale’s latest data, the overall rate sat a little above half a percent, with Apparel & Accessories highest and Pets & Animals lowest. The TikTok ads CTR page goes deeper.
What is the average CPA for TikTok ads?
The overall CPA for ecommerce brands in Triple Whale’s latest data is in the overall picture table near the top of this page. Category medians range widely, from Pets & Animals at the low end to Electronics at the high end, so compare against your own category and your order value.
How does TikTok’s ROAS compare to Meta’s?
There is no single public dataset that compares the two fairly for every brand. The cleanest answer comes from your own account: run both platforms with the same attribution window, then compare cost per new customer and ROAS side by side. Differences in attribution often explain more of the gap than the platforms themselves.
Why do some industries pay more for TikTok ads?
In the latest ecommerce data, impression costs were close across industries, so the bigger gaps came from cost per sale. Products that need research before buying, such as electronics, convert less often per click, which raises CPA. Order value then decides whether that higher CPA still pays.
Does TikTok Shop improve ad performance?
It can, because buyers check out inside the app instead of loading an outside page. We could not find an official TikTok Shop conversion benchmark, so test it against your website campaign with the same product and budget. TikTok’s Spark Ads figures above come from its Video Shopping Ads help page, which covers Shop formats.
What budget do I need to get meaningful TikTok ad data?
TikTok’s budget rules require a daily budget above $50 at campaign level and above $20 at ad group level. That is a floor, not a performance budget. For conversion campaigns, plan enough spend for each ad group to collect conversions and leave the learning phase. The minimum budget for TikTok ads guide goes deeper into this.
Wrapping Up
Benchmarks don’t tell you what to do; they tell you where to look. If your CTR trails your category, that’s a creative signal. If your CPA runs high while CTR and conversion rate look fine, check your price, order value and checkout.
If your ROAS looks low next to another platform, check attribution settings before you blame TikTok.
Use these medians as a starting point, then build your own baseline. Month-over-month progress against your own numbers, plus your Industry Benchmark ranking in Ads Manager, will tell you more than any single average.