If your TikTok ads feel like they’re underperforming, the real question isn’t “are my numbers bad?”, it’s “bad compared to what?” TikTok ads benchmarks by industry give you the reference point you actually need.
A 0.7% CTR in the finance vertical is solid. In beauty, it might mean your hook isn’t landing.
This guide breaks down CPM, CTR, CPA, and ROAS benchmarks across the most active advertising verticals on TikTok in 2026.
You’ll walk away knowing where your numbers stand, what’s driving variance between industries, and what to prioritize next.
Here’s what you’ll find in this report:
- Cross-industry TikTok ad benchmarks for 2026
- CPM, CTR, CPC, and CPA broken down by vertical
- How Spark Ads and TikTok Shop are shifting the numbers
- Practical guidance for underperforming campaigns
Get Up to $6000 Free TikTok Ad Credit
Table of Contents
Key Takeaways
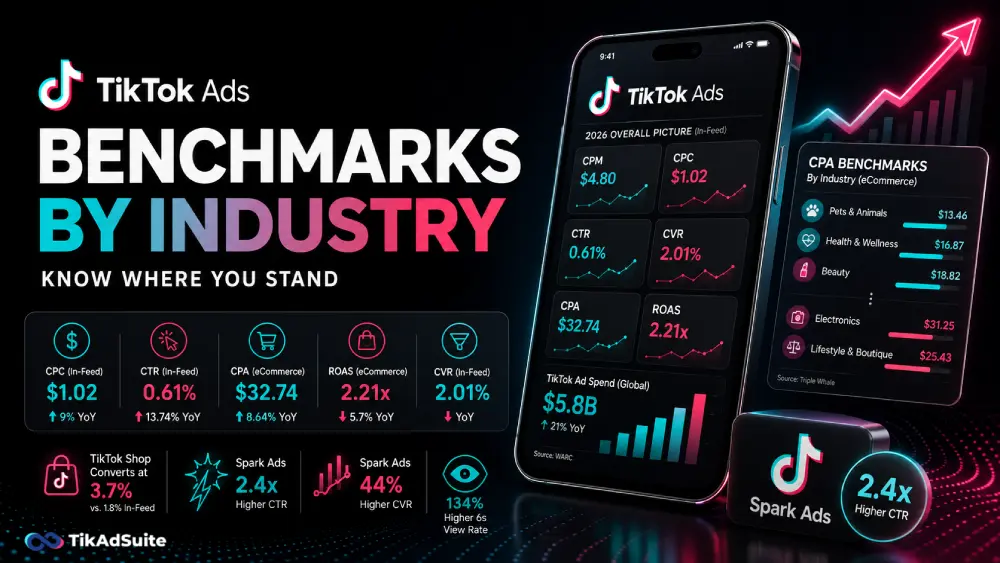
- The cross-industry average TikTok CPC for in-feed ads sits at $1.02 in 2026, up 9% year over year
- Average CPM ranges from $4.80 to $13.26, depending on the dataset and campaign objective
- Beauty ($0.74) and retail ($0.79) lead on CPC efficiency; finance ($1.71) and legal ($1.92) sit at the premium end
- Spark Ads produce 2.4x higher CTR and convert 44% better than standard in-feed creative
- TikTok Shop product ads convert at 3.7%, compared to 1.8% for in-feed and 2.6% for Spark Ads
What Are TikTok Ads Benchmarks?
TikTok ads benchmarks are average performance metrics, CPM, CTR, CPC, CPA, CVR, and ROAS, measured across a large sample of campaigns within a specific industry or across all verticals. They give advertisers a realistic reference point for evaluating campaign health. Because TikTok’s ad auction, audience behavior, and creative format differ significantly from other platforms, benchmarks from Meta or Google don’t apply here.
2026 TikTok Ads: The Overall Picture
Before diving into verticals, here’s where the platform sits overall.
According to WARC, TikTok ad spend is expected to reach $5.8 billion, up 21% year over year, as brands that paused budgets returned to the platform. TikTok Shop’s breakout year (reaching $32 billionin global GMV) reshaped conversion benchmarks across the board. (Source)
The baseline metrics for in-feed ads in 2026:
| Metric | Cross-Industry Average |
| CPM | $4.8 |
| CPC (In-Feed) | $0.10 – $1.00 |
| CTR (In-Feed) | 0.61% |
| CVR (In-Feed) | 2.01% |
| CPA (eCommerce) | $32.74 |
| ROAS (eCommerce) | 2.21 |
The wide CPM range reflects real differences in campaign objectives, audience targeting depth, and advertiser competition by vertical. For a deeper look at how TikTok ad costs break down, it helps to separate brand awareness spend from direct-response campaigns, which operate in different cost tiers entirely.
TikTok Ads CPM Benchmarks by Industry
CPM, what you pay per 1,000 impressions, varies more than most advertisers expect. According to Lebesgue, the average CPM for conversion-optimized eCommerce campaigns sits at $4.80. WebFX reports a broader average of $9.16, while Triple Whale’s lands at $13.26 for brands running conversion campaigns.
The gap isn’t a data error. It reflects who’s in each dataset. Established eCommerce brands running aggressive ROAS targets naturally compete harder in the auction and push CPMs higher.
For a more granular breakdown of what’s driving these costs and how to bring them down, the TikTok CPM rates guide covers the levers in detail.
Industries with naturally lower CPMs (sports, home goods, food) often face the flip side: cheaper impressions, but lower conversion rates. Cheaper reach doesn’t automatically mean cheaper results.
TikTok Ads CPA, CPM, and AOV Benchmarks by Industry
TikTok ad costs can vary a lot depending on what you sell. Some products naturally fit TikTok’s style, while others are harder to promote in short videos.
| Industry | TikTok CPA | TikTok CPM | Average Order Value |
| Apparel & Accessories | $21.85 | $4.24 | $68.40 |
| Beauty | $18.82 | $5.28 | $34.43 |
| Home & Garden | $21.36 | $5.69 | $53.08 |
| Food & Beverage | $19.84 | $6.33 | $31.96 |
| Toys, Art, & Collectibles | $20.94 | $4.56 | $45.21 |
| Sports & Outdoors | $19.83 | $3.79 | $49.99 |
| Electronics | $31.25 | $5.17 | $60.50 |
| Health & Wellness | $16.87 | $5.34 | $33.11 |
| Pets & Animals | $13.46 | $5.21 | $12.84 |
| Lifestyle & Boutique | $25.43 | $4.25 | $50.98 |
According to Triple Whale, Pets & Animals had the lowest average CPA at $13.46, followed by Health & Wellness at $16.87 and Beauty at $18.82. These categories usually perform well because the content feels natural on TikTok. Pet clips, skincare routines, and wellness videos already attract strong engagement, so ads often blend into the feed more easily.
Electronics had the highest CPA at $31.25. Tech products often need more explanation before someone buys, which can increase acquisition costs. Lifestyle & Boutique brands also saw higher CPAs because these products depend heavily on strong branding and creative quality to stand out.
CPM rates stayed fairly close across most industries, ranging from $3.79 to $6.33. This suggests that conversion performance matters more than reach alone. Average order value is also important. Electronics had a higher CPA, but customers spent more per order, which can still make campaigns profitable.
CPA and ROAS Benchmarks: The Conversion Picture
This is where most advertisers want to land, and where vertical fit matters most.
The average TikTok CPA across eCommerce brands sits at $32.74, up 8.64% from the prior year. ROAS came in at 2.21, down 5.7% year over year, while CVR slipped to 2.01%.
The takeaway: more people are clicking (CTR improved 13.74%), but conversion rates have softened. That’s a landing page and offer issue, more than a media issue. Your TikTok conversion rate benchmarks are only as good as what happens after the click.
Industry-level ROAS tells a more divided story. Verticals with low AOV and frequent purchases (beauty, food, wellness) tend to show stronger ROAS because conversion cycles are short. High-consideration categories, travel, B2B, and auto, show lower ROAS on TikTok because the platform catches users early in the research phase, not at the point of purchase.
For eCommerce advertisers, the TikTok ads for eCommerce guide is a useful companion for understanding how to structure campaigns around these conversion dynamics.
Industry Spotlight: How Your Vertical Stacks Up
Beauty and Fashion
Two of the strongest-performing verticals on TikTok. Beauty brands benefit from visual, demo-friendly content, low CPC ($0.74), and a purchase cycle that aligns with impulse behavior. Fashion follows closely, UGC-style try-on content consistently outperforms polished studio creative. If you’re in this space, check the TikTok ads for fashion brands breakdown for creative direction.
Fitness and Wellness
CPC sits at $1.12 with a moderately strong CVR. The challenge here is audience fatigue; fitness content is highly produced on TikTok, so differentiation requires specificity. Transformation stories and before/after formats still drive strong engagement. The TikTok ads for fitness and gym businesses guide covers what’s working in this vertical right now.
Restaurants and Food & Beverage
Food content performs exceptionally well organically on TikTok, but converting viewers into paying customers requires local targeting precision and a clear call to action. At $1.05 CPC, the entry point is reasonable. See the TikTok ads for restaurants and cafes playbook for format recommendations.
Travel and Hospitality
Higher CPC at $1.21 and longer consideration cycles make TikTok a top-of-funnel play for most travel brands. The platform works well for inspiration-stage targeting, but you need retargeting layers to capture conversions. The TikTok ads for travel companies guide walks through how to structure that funnel.
B2B and SaaS
This is where TikTok benchmarks diverge most from expectations. CPC is $1.34, and conversion rates are lower because B2B decisions aren’t made on impulse. But brand awareness and lead generation can work well with the right format. The TikTok ads for B2B companies guide is the right starting point.
Spark Ads vs. In-Feed: A Gap You Can’t Ignore
One of the most significant benchmark dividers in 2026 isn’t vertical, it’s ad format.
According to Digital Applied’s Q1 2026 data, Spark Ads (paid amplification of organic creator posts) produce:
- 2.4x higher CTR than branded in-feed creative
- 44% higher conversion rates (2.6% CVR vs. 1.8% for in-feed)
- 134% higher six-second view rate
The CPC premium is real, Spark Ads average $1.41 vs. $1.02 for in-feed, but the effective CPA is materially lower in most consumer verticals. For most brands, the math favors allocating 40–60% of budget to Spark Ads, especially in beauty, fashion, and fitness categories.
Understanding the tradeoffs in detail is worth the time. The Spark Ads vs. non-Spark Ads breakdown covers when to lean into each format.
What to Do When You’re Below Benchmark
If your numbers are trailing your vertical’s benchmarks, here’s how to diagnose the problem:
- Low CTR: Your hook (first 1–2 seconds) isn’t stopping the scroll. Test new opening frames, questions, or pattern interrupts before changing targeting.
- High CPC: Broaden your audience or refresh creative. A fatigued creative raises your effective CPC because lower engagement triggers higher auction bids. Reviewing your TikTok ad bidding strategies can help you recalibrate.
- Low CVR: The issue is post-click, not the ad. Check landing page load speed, offer clarity, and checkout friction.
- High CPA: Audit the full funnel. A TikTok ads budget optimization review often reveals that the budget is concentrated in low-CVR placements.
Comparing your TikTok ads metrics against vertical benchmarks regularly, not just quarterly, keeps you ahead of performance drift before it becomes a serious spend problem.
Frequently Asked Questions
What is a good CTR for TikTok ads in 2026?
A CTR between 0.8% and 1.5% is considered solid for in-feed ads across most verticals. Electronics and apparel tend to outperform, while financial services and B2B typically sit lower. For Spark Ads, 2.0%+ is achievable with strong creator content.
What is the average CPA for TikTok ads?
For eCommerce brands, Triple Whale’s 2025 full-year data puts the average TikTok CPA at $32.74. However, this varies significantly by vertical, AOV, and funnel structure. Brands with lower-priced products and shorter consideration cycles tend to see CPAs well below this average.
How does TikTok’s ROAS compare to Meta’s?
TikTok’s average eCommerce ROAS of 2.21 generally trails Meta’s performance averages for direct-response campaigns. However, TikTok shows stronger results for net-new customer acquisition. One analysis found TikTok’s CPA-to-net-new CPA delta was just 10%, versus 38% for Meta, suggesting TikTok reaches more new buyers.
Why do some industries pay more for TikTok ads?
Industries like finance, healthcare, and legal face higher CPMs and CPCs because of reduced creative flexibility (compliance restrictions), lower native content quality, and longer purchase cycles. TikTok’s algorithm rewards engaging, native-feeling content; verticals where that’s harder to produce naturally pay more.
Does TikTok Shop improve ad performance?
Yes, significantly. Product-tagged TikTok Shop ads convert at 3.7%, compared to 1.8% for standard in-feed. Brands integrated with TikTok Shop saw average CPA drop 19% year over year following improved Shop integration, the largest single-year improvement among major paid social platforms in 2025.
What budget do I need to get meaningful TikTok ad data?
TikTok recommends a minimum of $20/day per ad group, but that’s a platform floor, not a performance budget. For statistically meaningful data on conversion campaigns, a more practical starting point is $50–$100/day per ad group over a minimum two-week window. The minimum budget for TikTok ads guide goes deeper into this.
Final Thoughts
Benchmarks don’t tell you what to do; they tell you where to look. If your CTR is trailing your vertical’s average, that’s a creative signal. If your CPA is running high despite strong CTR and CVR, the funnel is the problem.
If your ROAS feels low compared to Meta, attribution methodology differences may be the explanation, more than actual underperformance.
Use these benchmarks as a diagnostic starting point, then build your own historical baseline. Your month-over-month improvement against your own numbers will always be more meaningful than chasing an industry average.