
Most TikTok ad campaigns fail not because of bad creatives, but because nobody is reading the data correctly.
You are spending money every day, and the dashboard is telling you exactly what is working and what is draining your budget. The problem is knowing where to look and what to act on.
Every section of the TikTok Ad Analytics Dashboard serves a specific purpose. Every component gives you a specific layer of insight.
This article walks you through all of it: how to access the dashboard, what each component does, how to customize your view, and how to use the attribution features to make faster and smarter campaign decisions.
Get Up to $6000 Free TikTok Ad Credit
Table of Contents
What Is the TikTok Ad Analytics Dashboard?
The TikTok Ad Analytics Dashboard is the reporting center inside TikTok Ads Manager where you monitor and analyze the performance of all your paid campaigns. It consolidates key data, including spend, impressions, clicks, and conversions, across campaigns, ad groups, and individual ads into one interface, but results vary based on your campaign objective and the data volume your account has built up.
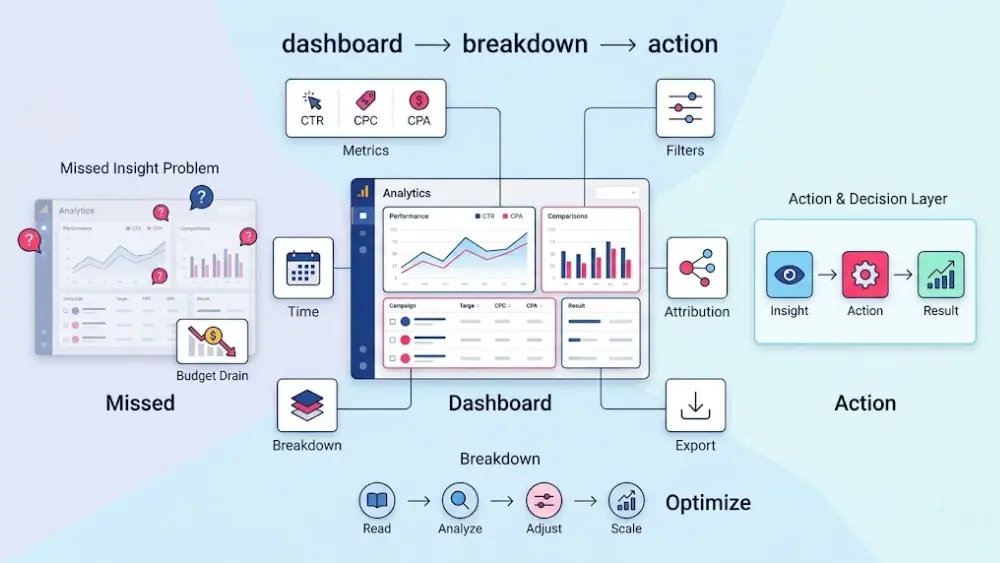
Why the TikTok Ad Analytics Dashboard Is Your Most Important Marketing Tool
Every dollar you spend on TikTok ads produces data. That data tells you exactly where your budget is working and where it is being wasted. Without the dashboard, you are guessing. With it, you have a clear, structured record of what happened, what it cost, and what it produced.
One of the core mistakes is stopping after only checking the ad spends. The dashboard gives you conversion data, audience behavior, creative performance, and cost efficiency all in one place. You are not just watching numbers move; you are building an accurate picture of what your audience responds to.
If you run TikTok ads without consistently reviewing your analytics, you will keep repeating the same mistakes at the same cost. The data is there; whether you use it is up to you.
What You Can Achieve With Data-Driven TikTok Ad Decisions
When you use the dashboard correctly, four outcomes become real:
- You stop putting a budget behind campaigns that are not converting
- You identify which creatives are driving the lowest CPA and concentrate spend there
- You refine audience targeting based on actual demographic performance data instead of assumptions
- You report results to clients or stakeholders with real evidence, not rough estimates
We have watched accounts catch a slow CPA creep early by reviewing their trends graph weekly, avoiding budget waste that would have gone unnoticed for weeks. The dashboard makes those patterns visible. Your judgment does the rest.
How to Access the TikTok Ad Analytics Dashboard
Getting to your TikTok ad data takes less than a minute if you know the path.
Here is exactly how to get there:
1. Go to ads.tiktok.com and log in to your TikTok for Business account.
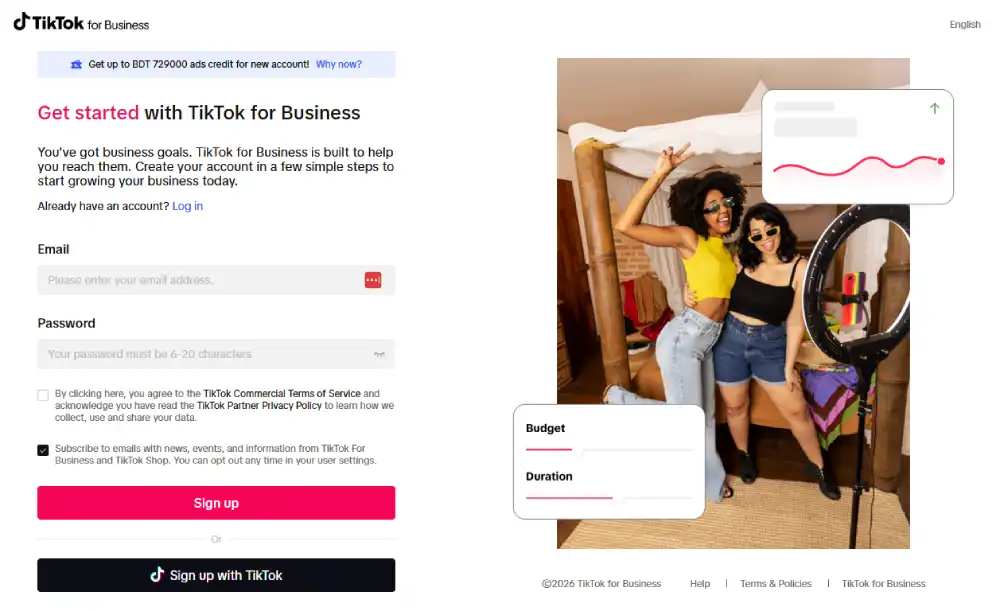
2. From the top navigation, click Ads Manager.
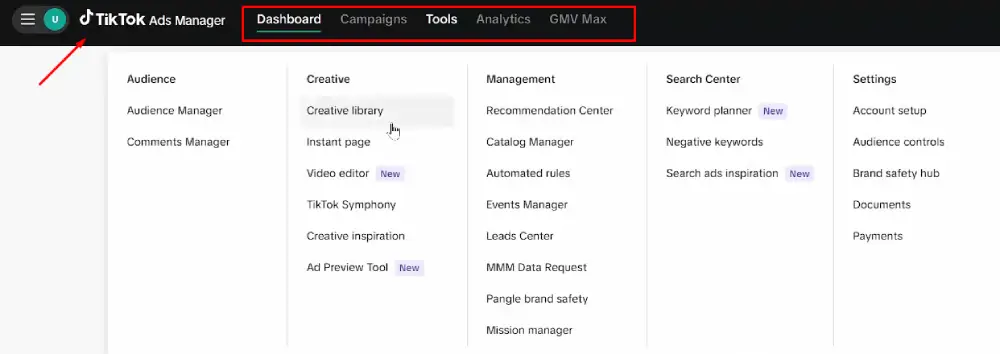
3. Once inside Ads Manager, click the Dashboard tab in the top navigation bar.
4. Your dashboard loads with a summary of account performance, active campaign status, and key metrics for your selected date range.
On your first login, you will see three main sections across the top navigation: Dashboard, Campaigns, and Analytics. Each one exists to answer a different type of question about your campaign performance. All three are covered in the sections below.
The Three Core Sections of TikTok Ads Manager
TikTok Ads Manager is organized into three distinct sections. Each one serves a different level of analysis. Knowing which section to open and when saves you time and sharpens every decision you make.
The Dashboard Tab: Your High-Level Account Overview
The Dashboard tab is your daily starting point. It shows a summary of your account performance for your selected date range: total spend, active ad group status, delivery alerts, TikTok recommendations, and a performance trend visualization.
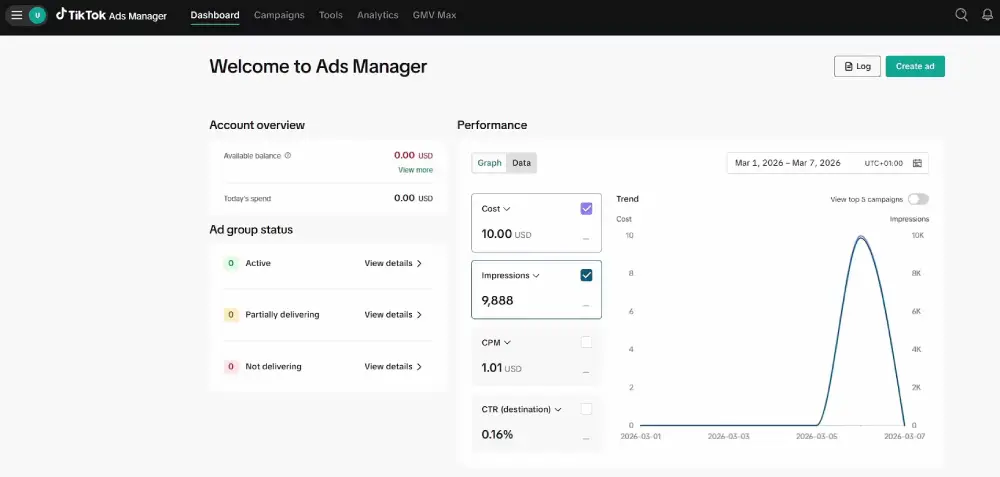
TikTok’s recommendation panel lives here, too. It flags delivery issues, budget caps hitting, and account-level suggestions. Use this tab for your quick daily check-in. It tells you whether anything has broken or shifted overnight without requiring you to open a single campaign.
Best for: Morning performance checks, spotting delivery problems fast, and catching drops in spend or impressions before they cost you more.
The Campaigns Tab: Drilling Into Campaign, Ad Group, and Ad Data
The Campaigns tab is where actual performance analysis happens. You can switch between three levels: Campaign, Ad Group, and Ad. Each level shows you the metrics for that specific layer of your campaign structure.
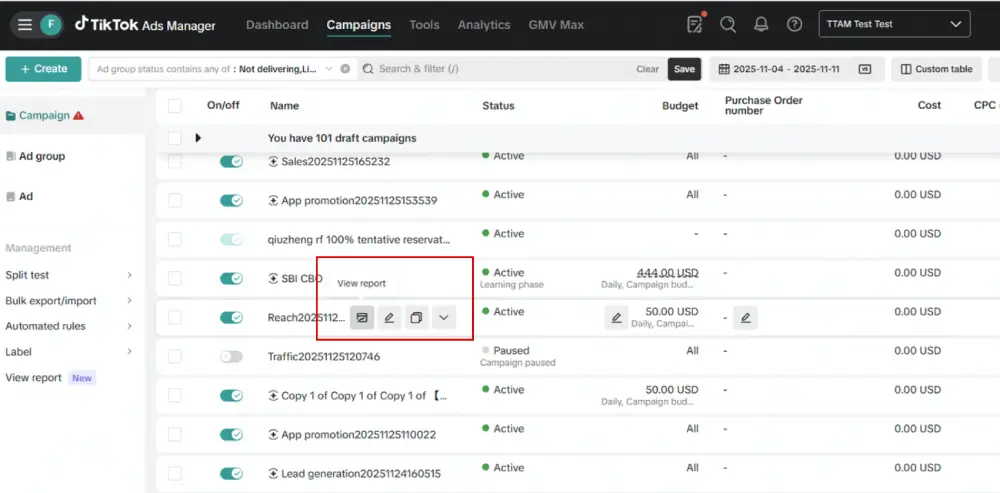
The View Data panel opens on the right when you hover over any row, giving you a quick visual breakdown of that item’s performance trend. You can toggle date comparison to view two time periods side by side. Filters let you narrow by objective type, campaign status, or budget range.
Best for: Performance diagnosis, finding which level is causing a problem, and making targeted budget adjustments.
The Analytics Tab: Custom Reports, Attribution, and Audience Insights
The Analytics tab is your deep-analysis workspace.
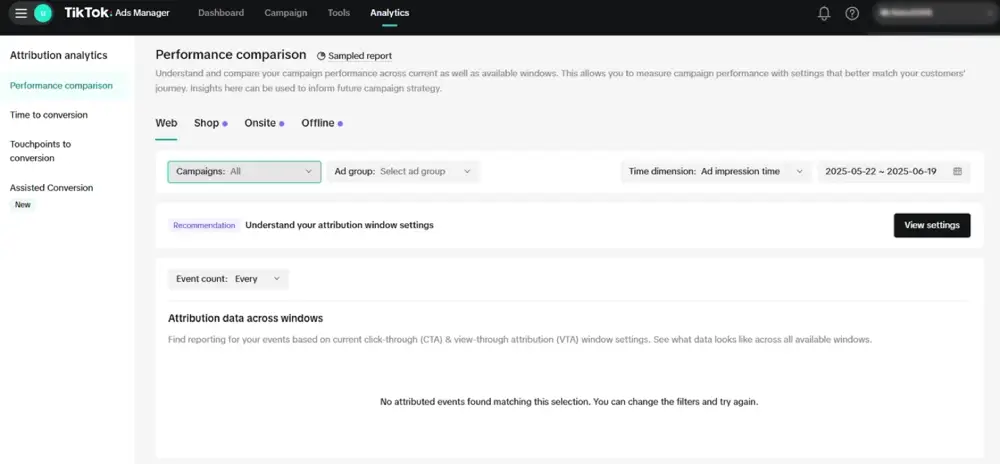
It contains six distinct report types:
- Custom reports: Build your own report using any combination of metrics and dimensions
- Attribution analytics: Analyze conversion paths, attribution windows, and touchpoints to conversion
- Audience insights: Understand who your ads are reaching and how different segments behave
- Comment insights: Review what users are saying in the comments of your ads
- Creative inspirations: Benchmark your creative approach against top-performing TikTok ad formats
- Video insights: Review video-level engagement data, including watch time and completion rate
Best for: Monthly deep dives, client reporting, creative testing analysis, and attribution troubleshooting.
Key Components of the TikTok Ad Analytics Dashboard
The dashboard is not a single screen. It is a system built from six distinct components, each showing a different layer of your campaign performance.
Overview / Top Metrics Panel: Your Campaign’s Vital Signs
What it is: The summary bar at the top of your Ads Manager dashboard. It aggregates performance data across all active campaigns for your selected date range into a single at-a-glance view.
What it shows: Total spend, impressions, clicks, conversions, and results at the account level.
Why it matters to you: This panel tells you in seconds whether your account is healthy. If impressions are dropping while spend stays flat, your CPM is rising, and delivery is becoming less efficient. You do not need to open a single campaign to catch that shift.
How to use it: Set your date range before reading anything else. Use the date toggle to compare the current period against the previous one. If your spend is steady but clicks have dropped noticeably, your CTR has weakened, and your creative likely needs testing against a fresh variant before the problem compounds.
Use our free tool to troubleshoot and fix your declining CTR and boost performance.
Campaign / Ad Group / Ad Level Table: Your Performance Drill-Down
What it is: The main data table inside the Campaigns tab. It lets you switch between campaign, ad group, and individual ad views to isolate performance at each level of your campaign structure.
What it shows: Status, budget, spend, CPC, CPM, impressions, clicks, CPA, conversions, and CTR. Every row represents one campaign, ad group, or ad, depending on the level you have selected.
Why it matters to you: This is where you find the actual source of a performance problem. A campaign might look weak at the top level. But when you drop to the ad group level, you may find one audience segment converting at half the CPA of the others. That insight only comes from drilling down systematically.
How to use it: Start at the campaign level. Find the underperformer. Move to the ad group level to check whether it is an audience problem. Then go to the ad level to determine whether it is a creative problem. Follow the hierarchy every time and do not skip levels.
Customization Toggle: See Only the Metrics That Matter for Your Goal
What it is: A column selector within the Campaigns tab that lets you add or remove metrics from your data table. TikTok gives you access to more than 30 available metrics.
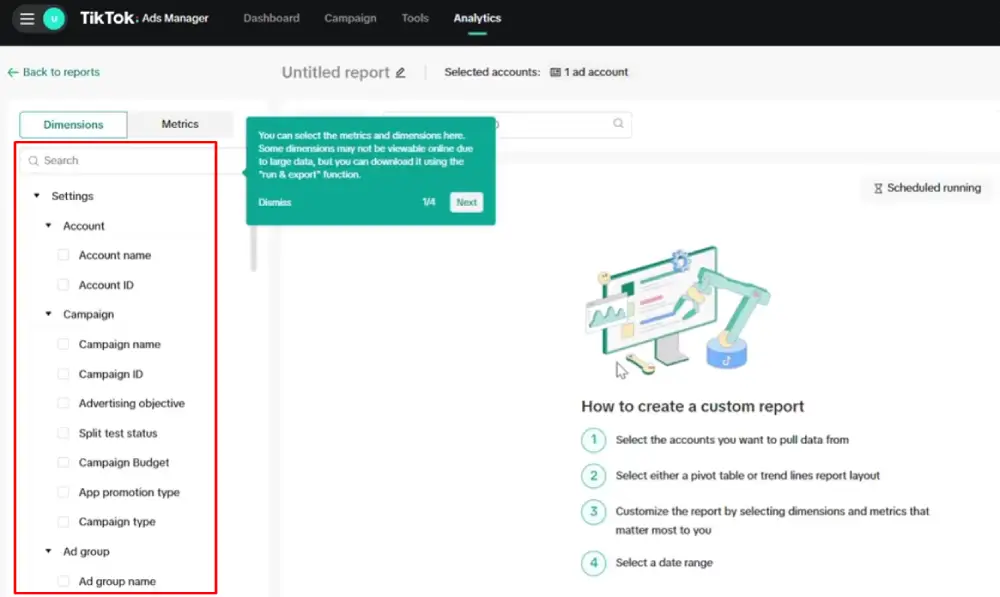
What it shows: Any combination of metrics you choose, including CTR, CPC, CPM, ROAS, video play actions, conversion events, frequency, and more.
Why it matters to you: The default column set is not built for any specific objective. If you are running an awareness campaign, CPA columns create noise. If you are running a conversion campaign, reach metrics matter far less. Customizing your view removes that noise and keeps your analysis sharp.
How to use it: Create a separate column preset for each objective type you run regularly. Save one layout for awareness campaigns, another for conversion campaigns. This cuts the time you spend filtering irrelevant data on every login.
Performance Trends Graph: Spot Patterns Before They Become Problems
What it is: A line or bar chart that plots your selected metrics over your chosen date range. You can switch between daily and weekly views depending on the period you are analyzing.
What it shows: Day-over-day or week-over-week movement in any metric you have selected, including spend, CTR, conversions, and CPA.
Why it matters to you: A table shows you where you are right now. The trends graph shows you where you are heading. A CTR that has declined for five consecutive days signals creative fatigue, even if your overall CTR for the full date range still looks acceptable on paper.
How to use it: Plot CTR and spend together on the same graph view. If spend holds steady but CTR falls, your creative is losing its pull. Plotting CPA over a 14-day window helps you catch audience saturation before it fully drains your budget.
Audience Breakdown: Understand Exactly Who Is Responding to Your Ads
What it is: A demographic segmentation view available through the Breakdown feature and the Audience Insights report inside the Analytics tab. It splits performance data by the characteristics of the people seeing and interacting with your ads.
What it shows: Performance data segmented by age group, gender, country, device type, placement, and operating system.
Why it matters to you: Your audience targeting is a hypothesis. The audience breakdown tells you whether the data confirms or contradicts it. You may be targeting a broad age range, but only one segment is converting at a profitable CPA, while the others drain budget quietly.
How to use it: Sort your breakdown by CPA or conversion rate per segment to find where your spend is actually producing returns. Use those findings to tighten your ad group targeting around the highest-performing segments.
Campaign Objectives Breakdown: Align Your Spend With Your Goals
What it is: A view that groups your active campaigns by their selected objective type. It shows how your total budget is distributed across different goals, including conversions, traffic, awareness, lead generation, and app installs.
What it shows: Spend, results, and cost-per-result broken down by campaign objective across your account.
Why it matters to you: Budget imbalances are common and easy to miss when you are managing multiple campaigns at once. If most of your spend is going to conversion campaigns but your audience is largely cold and unaware of your product, you are investing at the wrong funnel stage.
How to use it: Review objective-level spend against your full-funnel strategy at least once a week. If awareness spend is near zero, and your conversion rates are falling, consider rebalancing before cutting conversion campaign budgets. Cold audiences rarely convert efficiently without some prior exposure to your brand.
Every TikTok Ad KPI Explained: What Each Metric Means and Why It Matters
Here’s how each KPI functions inside the dashboard and what action it should trigger when it moves. The emphasis here is on reading each signal in the dashboard context, organized by funnel stage from delivery through to conversion.
Quick Guide to TikTok Ad KPIs and What They Tell You
| Metric | What It Measures | What It Signals in the Dashboard | What to Watch For (Action Trigger) |
| Impressions | Total number of times your ad is shown (including repeat views) | Delivery volume and audience reach | Impressions dropping while CPM rises → shrinking reach due to competition |
| Ad Spend | Total cost over a selected time period | Foundation for all efficiency metrics (CPC, CPA, ROAS) | Spend increasing faster than conversions → early sign of rising CPA |
| CTR (Click-Through Rate) | % of users who click after seeing your ad | Creative effectiveness and audience interest | High CTR + low conversion rate → landing page or offer issue |
| CPC (Cost Per Click) | Cost per click (Spend ÷ Clicks) | Efficiency of driving traffic | Rising CPC with stable CPM → declining creative performance |
| CPM (Cost Per 1,000 Impressions) | Cost to reach 1,000 users | Cost of audience reach | Rising CPM → increased competition or expensive audience |
| ROAS (Return on Ad Spend) | Revenue generated per dollar spent | Overall profitability of campaigns | Inflated ROAS from attribution changes → unreliable performance data |
| CPA (Cost Per Acquisition) | Cost per conversion | Bottom-line efficiency | Rising CPA over time without budget change → audience saturation |
| Conversion Rate | % of clicks that convert | Post-click performance (funnel efficiency) | Low conversion rate with strong CTR → poor landing page alignment |
| Video Completion Rate | % of viewers who watch the full video | Creative retention and quality | Low completion rate → weak storytelling or content fatigue |
| Watch Time / 3s View Rate | How long users watch before dropping off | Early engagement and hook strength | Drop-offs before 3 seconds → weak hook, requires creative change |
Impressions: How Many Times Your Ad Was Shown
Impressions count every time your ad appears on screen, including multiple views from the same person. Inside the dashboard, impressions dropping without a budget change typically signal shrinking audience availability or rising CPM from increased auction competition in your target segment. A CPM spike will reduce your delivery volume before it appears visibly as a cost problem in your summary panel.
Watch for: Impressions and CPM moving in opposite directions while your budget holds steady. That combination tells you your reach is shrinking even though your spend has not changed.
Ad Spend: The Number Every Decision Should Start From
Ad spend is your total cost for the selected date range at whichever campaign level you are viewing. Every efficiency metric you care about, including CPC, CPA, and ROAS, is calculated relative to spend. If your attribution settings or reporting windows are inconsistent, every downstream metric becomes unreliable, regardless of how the spend number looks.
Watch for: Spend accelerating faster than your conversion volume is growing. That gap is the earliest dashboard indicator that your CPA is climbing before the number surfaces prominently in your summary row.
Stay ahead of rising costs, track your ad spend with our free TikTok ad spend tracker.
CTR (Click-Through Rate): Is Your Creative Compelling Enough?
CTR is clicks divided by impressions, multiplied by 100. According to Lebesgue’s TikTok Ads benchmark analysis, the average CTR for conversion-optimized TikTok ads sits around 0.61%, though this varies significantly by industry and creative format. A CTR trending downward over five or more days is a creative signal, not an audience or bidding signal.
Watch for: High CTR paired with a low conversion rate almost always points to a landing page or offer problem, not a creative problem. Your ad is getting people to click. Something after the click is losing them.
CPC and CPM: Measuring the Cost of Every Click and Every Thousand Views
CPC is spend divided by clicks. CPM is spend divided by impressions, multiplied by 1,000. According to Triple Whale’s TikTok benchmark data, among eCommerce brands, the median CPM on TikTok rose 16% year over year to $13.26 in 2025, while median CPA among that same panel climbed to $32.74. A rising CPC with a stable CPM is a clean signal that your CTR has dropped. It means your audience has not become more expensive to reach. Your creative has become less effective.
Watch for: CPC spiking while CPM holds steady. That points to a creative problem, not a targeting or auction problem.
ROAS (Return on Ad Spend): The Metric That Proves Your Campaign’s Worth
ROAS is revenue from ads divided by total ad spend. What counts as viable depends entirely on your margins. A business at 70% gross margins breaks even at a ROAS of roughly 1.43. A business at 20% margins needs a minimum ROAS of 5 just to cover ad costs. Calculate your own floor before you set a campaign target, because a universal benchmark is meaningless without your margin data behind it.
Watch for: ROAS figures can look inflated if your attribution window is too wide. Always compare ROAS across consistent attribution settings. Changing windows mid-campaign makes your historical data unreliable for benchmarking.
CPA and Conversion Rate: Your Bottom-Funnel Performance Signal
CPA is spend divided by conversions. Conversion rate is conversions divided by clicks, multiplied by 100. Together, these two metrics tell you whether your ad is generating real business outcomes, not just traffic. You can have strong CTR and a damaging CPA if your landing page, offer, or post-click experience does not align with what your creative set-up.
Watch for: CPA rising steadily over 10 to 14 days without a budget increase is a reliable signal for audience saturation. Your ad has already reached the most responsive users in that segment, and the remaining pool is converting at a much lower rate.
Video Completion Rate and Watch Time: The Engagement Metrics TikTok Actually Rewards
Video completion rate is the percentage of viewers who watched your ad to the end. Per TikTok’s official Engaged View-through Attribution documentation, TikTok counts any view where a user watches 6 seconds or more as an engaged view, which is the threshold the platform uses for engaged attribution credit. TikTok’s own advertiser guidance also notes that higher completion rates are a positive quality signal that can improve delivery efficiency over time.
Watch for: Track your 3-second view rate as a separate early warning signal. If a significant portion of viewers leaves before the 3-second mark, your opening hook is losing people before your core message even begins. No budget adjustment fixes that without a creative change.
How to Customize Your TikTok Ads Dashboard for Your Specific Goals
The default TikTok Ads Manager column view is not optimized for any single objective. It is a generic starting configuration. Your job is to rebuild it around what you are actually measuring right now.
Here is how to create a customized dashboard view:
- Open the Campaigns tab in Ads Manager.
- Click the Columns button on the right side of the data table header.
- Select the metrics you need and deselect those irrelevant to your current objective.
- Click Save and label your preset clearly, for example, “Conversion View” or “Awareness View.”
Recommended column sets by objective type:
- Awareness campaigns: Impressions, Reach, CPM, Frequency, Video Completion Rate
- Traffic campaigns: Clicks, CTR, CPC, Landing Page Views
- Conversion campaigns: Conversions, CPA, ROAS, Conversion Rate, Total Cost
Saving separate presets means you are not scanning through irrelevant columns every time you open the platform. It keeps your analysis focused on the numbers that matter for the campaign you are running today, not the one you ran last month.
How to Use the Breakdown Feature to Slice Your TikTok Ad Data
The Breakdown feature is one of the most useful tools inside Ads Manager and consistently one of the least used. It lets you segment your existing performance data without building new campaigns or pulling separate reports.
To access it:
- Open the Campaigns tab.
- Select a campaign, ad group, or individual ad.
- Click the Breakdown button at the top of the data table.
- Choose your breakdown type: Time (day, week, or month) or Audience (age, gender, country, placement, device, or operating system).
Time breakdowns show you when your campaign performed at its best and where drops or spikes occurred during the period. If your CPA is efficient Tuesday through Thursday but rises sharply on weekends, you now have the data to concentrate your budget around the days where your spend works hardest.
Audience breakdowns reveal which demographic segments are actually responding to your ads. If one specific segment is converting at three times the rate of others, you can build tightly targeted ad groups around that finding. The insight is already in your existing data. The Breakdown feature surfaces it without any extra reporting work.
TikTok Ads Attribution Analytics
Attribution analytics answers one of the most important questions any advertiser faces: which touchpoints actually led to a conversion, and how long did it take to get there?
Inside the Analytics tab, the Attribution Analytics section gives you three distinct views:
- Performance comparison: Shows how your reported conversion numbers change depending on your selected attribution window
- Time to conversion: Shows how long it typically takes a user to convert after their first interaction with your ad
- Touchpoints to conversion: Shows how many ad interactions occurred before a user completed a conversion event
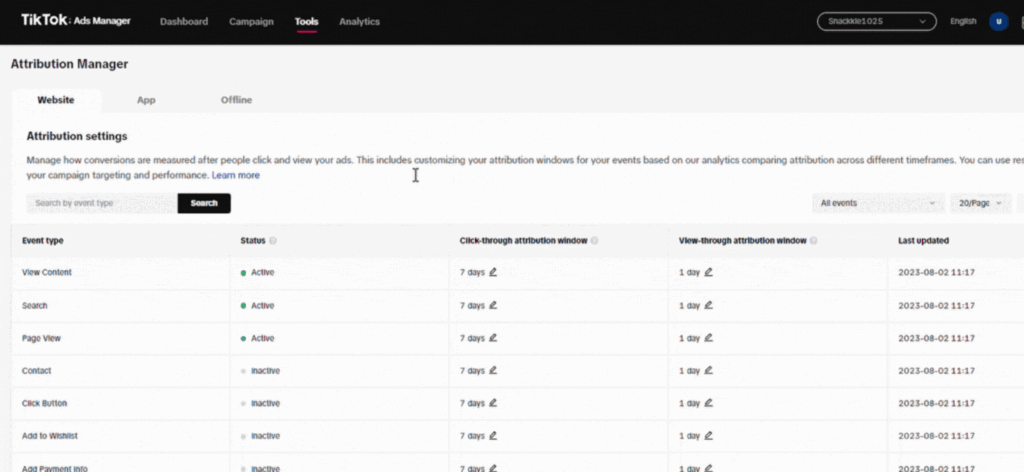
Per TikTok’s official attribution documentation, click-through attribution windows run from 1 to 28 days, while view-through attribution windows can be set to off, 1 day, or 7 days. Your CPA and ROAS numbers will look meaningfully different depending on which window was active when the data was captured, so comparing results across different window settings is unreliable.
TikTok Ads Manager defaults to 7-day click and 1-day view attribution. This works for most campaigns. But if you run in categories with longer purchase consideration periods, such as software, high-ticket products, or subscription services, a wider click window may give you a more accurate picture of your campaign’s actual contribution.
One thing we have seen cause consistent confusion in cross-channel setups: the same conversion can be claimed by TikTok, Google, and Meta simultaneously when all three are running at once. That inflates reported ROAS across all platforms. Keep this in mind whenever you compare channel-level performance figures without a unified attribution model in place.
TikTok Ad Metrics vs. KPIs: What’s the Difference and Why It Matters
TikTok Ad Metrics and KPIs are not the same thing, and treating them as interchangeable leads to poor campaign decisions at every budget level.
A metric is a raw data point your dashboard tracks automatically. Impressions, clicks, CPM, and watch time are all metrics. They measure activity and output. They do not, on their own, tell you whether that activity was good or bad for your specific business.
A KPI (Key Performance Indicator) is a metric you have tied to a specific business goal with a defined target. ROAS is a metric; “We need a minimum ROAS of 4 to stay profitable at our current margins” is a KPI.
The distinction matters most inside the dashboard because TikTok surfaces dozens of metrics at once. Without predefined KPIs, every number looks equally important and equally urgent. With them, the dashboard tells you exactly when to act and what to act on.
| Metric | KPI Example |
| Impressions | Reach 500,000 impressions per month within the current budget |
| CTR | Maintain CTR above 1% across in-feed placements |
| CPA | Keep CPA below $25 for all conversion campaigns |
| ROAS | Achieve a minimum ROAS of 3.5 before scaling spend |
| Completion Rate | Hold video completion rate above 40% on all ad creatives |
Define your KPIs before a campaign launches, not after. When you set targets first, the dashboard becomes a decision tool rather than a number you check out of habit.
FAQs
What metrics does TikTok Ads Manager show?
TikTok Ads Manager tracks a wide range of performance data, including impressions, reach, clicks, CTR, CPM, CPC, conversions, CPA, ROAS, video views, completion rate, frequency, and watch time. You can access these at the campaign, ad group, and individual ad level. The Analytics tab also provides attribution data, audience insights, and fully customizable report types that go well beyond the standard table view.
What is the TikTok Ads dashboard used for?
The TikTok Ads dashboard is used to monitor and manage the performance of your paid TikTok campaigns from one centralized location. It gives you a view of your account spend, delivery status, creative performance, and audience behavior across all active campaigns. You use it to understand what is generating results, where the budget is going to waste, and how to allocate spend more effectively going forward.
How do I analyze TikTok ad performance?
Start with the Dashboard tab for a quick account-level view, then move to the Campaigns tab to drill down by campaign, ad group, or individual ad. Use the Breakdown feature to segment your data by time period or audience demographic. For deeper analysis, open the Analytics tab to build custom reports and review your attribution data across different conversion windows.
What is the difference between TikTok ad metrics and KPIs?
Metrics are raw data points TikTok tracks automatically, such as impressions, clicks, and CPM. KPIs are metrics you have assigned a specific performance target to, based on your business goal. CPA is a metric. “Keep CPA below $20 for this campaign” is a KPI. The distinction matters because KPIs give you a clear threshold to act on, while raw metrics alone only describe what happened without telling you whether it was good or bad for your specific situation.
How does TikTok attribution analytics work?
TikTok attribution analytics tracks the path a user takes from seeing or clicking your ad to completing a conversion event. TikTok Ads Manager defaults to a 7-day click and 1-day view attribution window. You can adjust these settings before launching a campaign, but changing them mid-flight makes period-over-period comparisons unreliable. If you run TikTok alongside other paid channels, the same conversion may be claimed by multiple platforms simultaneously, which inflates ROAS figures across all of them.
What is a good ROAS for TikTok ads?
A good ROAS is one that covers your costs and leaves a margin, and that number is different for every business. Start by calculating the minimum ROAS your gross margin requires before a campaign produces any real profit. Most direct-to-consumer brands target somewhere between 3 and 5 as a working range, but that varies significantly by product category, price point, and how your funnel is structured. Set your floor based on your actual margin data, not on an industry average.
Conclusion
The TikTok Ad Analytics Dashboard is not complicated once you understand what each section is built to tell you. You have a Dashboard tab for fast daily health checks, a Campaigns tab for detailed performance work at every campaign level, and an Analytics tab for the deep reporting and attribution analysis that shapes strategic decisions.
The real shift happens when you stop reading metrics in isolation and start connecting them to each other. CTR without conversion rate tells you very little about campaign value. ROAS without a consistent attribution window gives you a distorted picture of profitability.
A CPA without a time trend can hide audience saturation that is already draining your budget long before it appears in a weekly summary.
Every core component of the dashboard, every essential KPI in the dashboard context, and how to configure your view for faster decisions is now in front of you. The analytics stop being a passive reporting screen the moment you understand what each signal means and what it should trigger.
Data does not make decisions. You do. The dashboard makes sure you are working from the right information when you do.